ATAC-Seq Services Overview
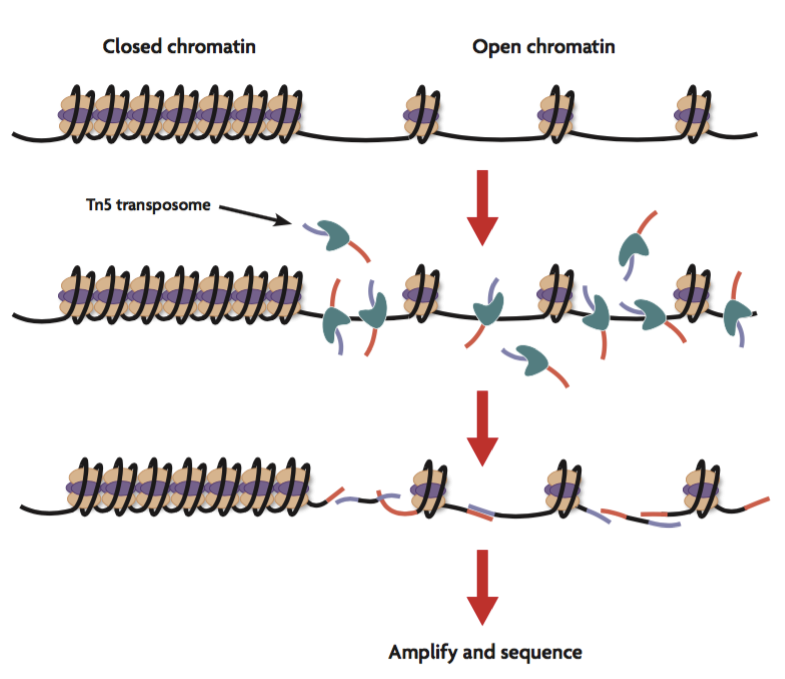
Assay for Transposase Accessible Chromatin Sequencing (ATAC-Seq) is used for genome-wide mapping of open chromatin, where gene regulatory elements such as promoters, enhancers, and insulators are active.
Why study open chromatin?
- Generate genome-wide open chromatin signatures in different patient populations
- Identify transcription factors and gene regulatory elements that drive disease
- Gain mechanistic insight into the gene regulatory response to treatments
- Develop models of dynamic chromatin reorganization during different stages of cell differentiation and development
ATAC-Seq is a perfect first step for those exploring the role of epigenetics in cell systems or disease models as it doesn’t require prior knowledge of gene regulation mechanisms.
The ATAC-Seq assay includes:
- Cell preparation
- Transposase reaction
- Library amplification
- Sequencing on an Illumina platform
- Bioinformatic analysis
Sample Types
Active Motif’s services will generate ATAC-Seq data from as little as 50,000 cells or 20 mg of tissue, from the following sample types:
- Human and animal tissues (including xenografts and human biopsies)
- Primary cells (including T and B cells)
- FACS sorted cells, including from rare cell populations
What our customers are saying about us:
"I am studying the epigenetic regulation of heart failure. I have had a very good experience with Active Motif Epigenetic services and I will continue research with Active Motif in the future. I received good support from both the Sales Department and the Tech Support Team to help me to go through all the aspects of the service."
Ning Feng, MD, PhD
University of Pittsburgh
View complete list of testimonials >

ATAC-Seq Services Data
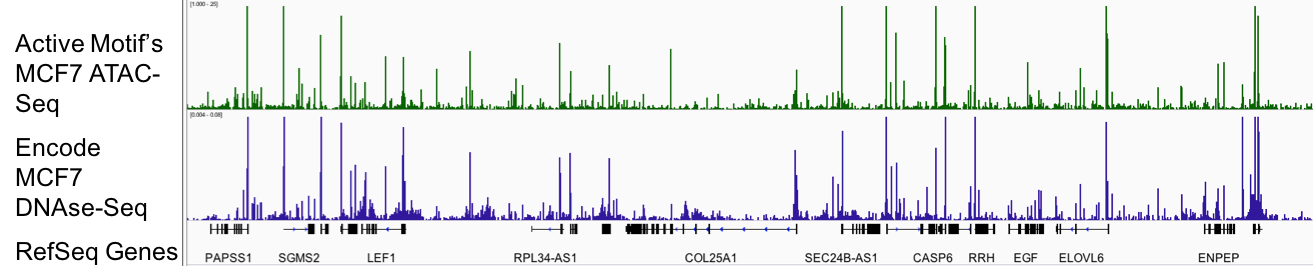
Figure 1: Active Motif’s ATAC-Seq assay reliably detects regions of open chromatin.
DNAse-Seq, which has long been the gold standard for generating genome-wide profiles of open chromatin, is shown above in blue. The utility of DNAse-Seq has been limited since it requires tens of millions of cells and is technically challenging. Active Motif’s ATAC-Seq (shown above in green), uses only 50,000 cells and provides data that is comparable to DNAse-Seq.
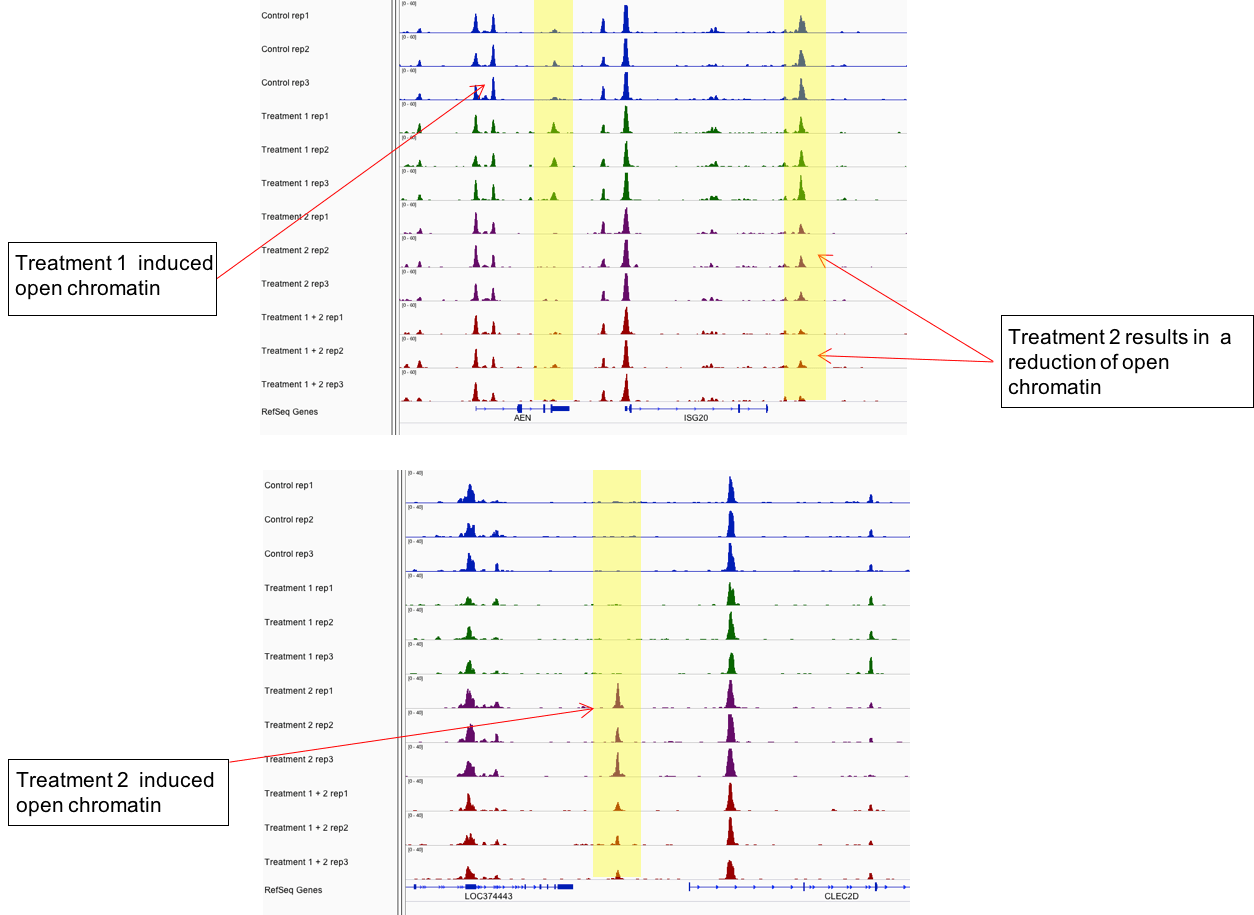
Figure 2: Active Motif’s ATAC-Seq assay distinguishes sample groups by identifying chromatin regions that are differentially open.
The example above shows ATAC-Seq data from 4 different samples, each performed in triplicate. Differentially open regions are highlighted in yellow.
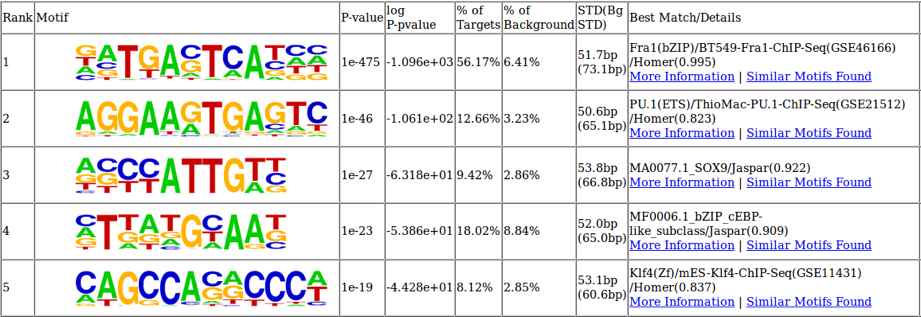
Figure 3: Identifying important transcription factor binding sites using ATAC-Seq
The underlying DNA sequence of differentially open chromatin regions can be analyzed to identify the most enriched transcription factor binding sites. In this cell system the two most enriched binding motifs are also relevant to B cell biology. Fra1 is quickly upregulated upon B cell activation and PU.1 is a key regulator of B cell fate specification.

Figure 4: Distribution of Histone Modifications Relative to ATAC-Seq Peaks at Annotated Promoters
Comparison of ATAC-Seq data to different histone modification ChIP-Seq data sets reveals that ATAC-Seq peaks at promoters are most enriched for H3K4me3 and H3K9Ac.
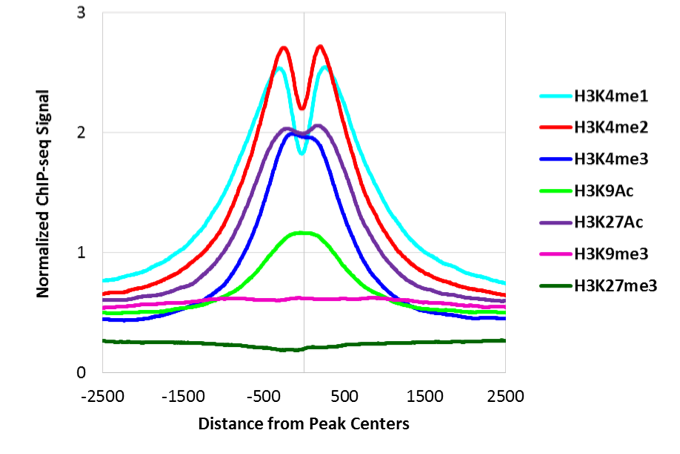
Figure 5: Distribution of Histone Modifications Relative to ATAC-Seq Peaks Outside of Annotated Promoters
ATAC-Seq peaks outside promoters are enriched for all active marks including the enhancer marks H3K27Ac and H3K4me1.
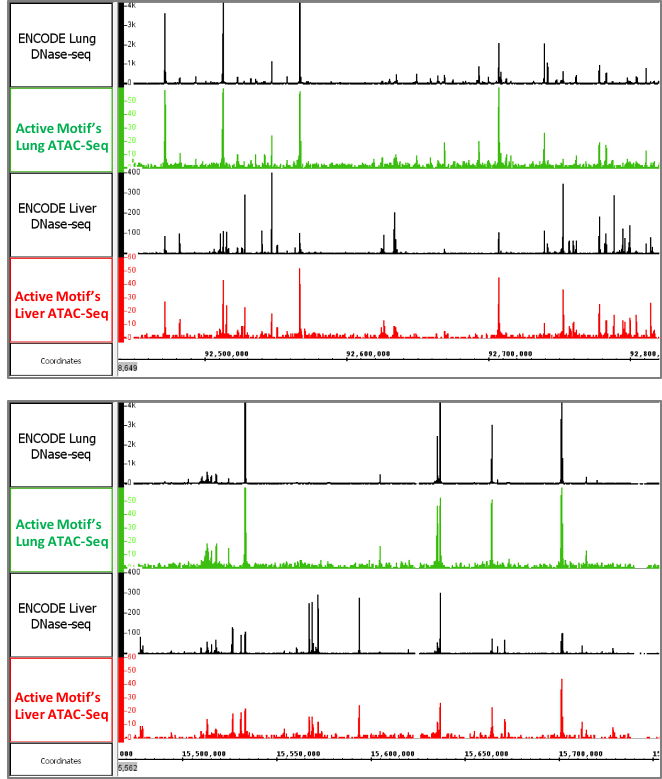
Figure 6: Active Motif’s ATAC-Seq data generated from tissues
The images above show ATAC-Seq data generated using frozen mouse liver and lung tissue. The open chromatin profiles are similar to DNAse-Seq profiles generated by the ENCODE consortium.
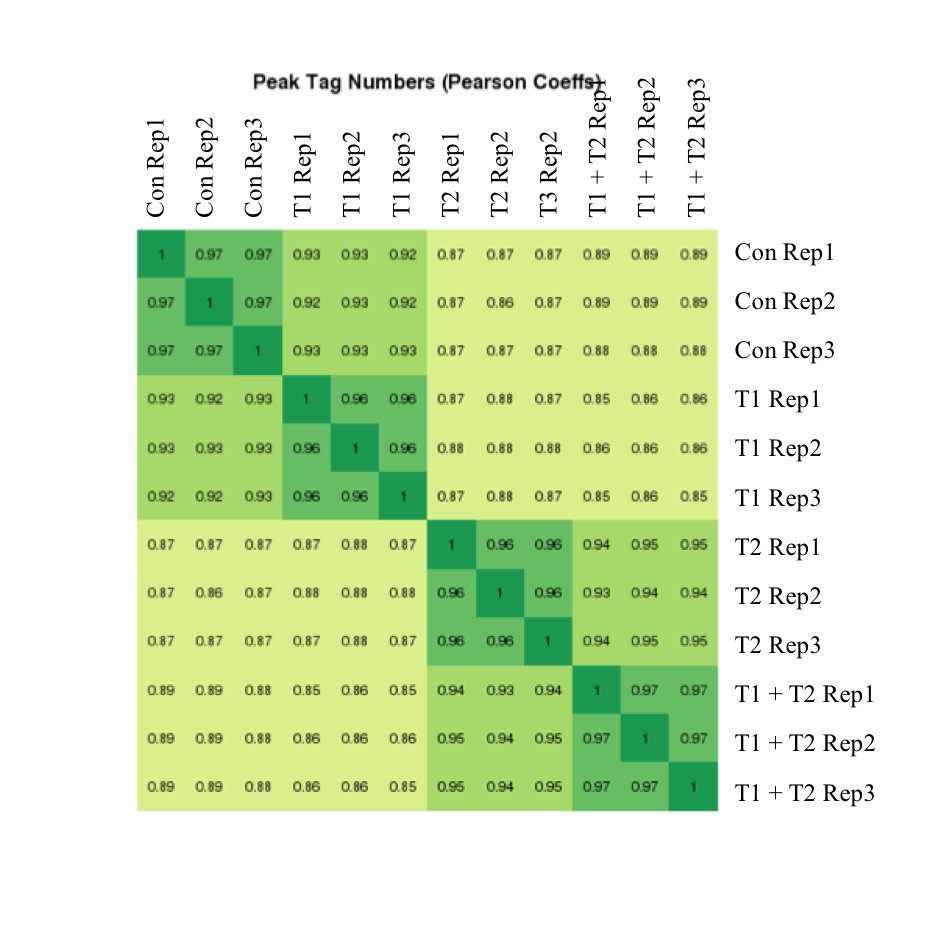
Figure 7: Active Motif’s ATAC-Seq data shows high reproducibility
The experiment above was performed using a cell line that was left untreated or treated under three different conditions and each condition was performed in triplicate. The correlation coefficients are presented in the heat map. Replicates have coefficients of at least 0.96. The heat map shows that the samples cluster into four distinct groups as expected.
ATAC-Seq Quality Measures
There are multiple ways to assess the quality of an ATAC-Seq data set. The two that are considered the most important are FRiP Score and Peak Number.
- FRiP Score: Fraction of Reads in Peaks is the percentage of reads that overlap within called peaks. It is a measure of the enrichment of open regions and can also be considered as a measure of signal-to-noise, with signal being reads that map in peaks and noise being reads that map outside of peaks. FRiP scores will vary depending on cell type. FRiP scores of >30% are a good indication of success. However, lower FRiP scores are acceptable in more difficult samples as long as there is consistency across those samples.
- Peak Number: Number of peaks identified in an ATAC-Seq data set. Data repository consortia like ENCODE recommend that data sets have more than 50,000 peaks identified. This however varies depending on the cell type, tissue and health of cells.
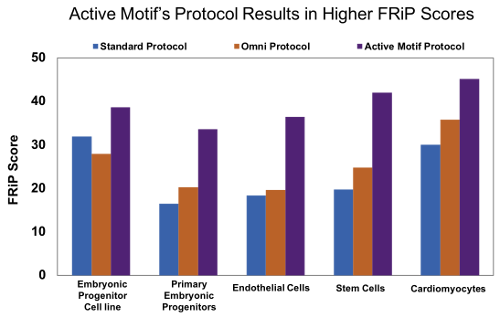
Figure 8: Active Motif’s optimized ATAC-Seq protocol results in increased FRiP scores.
Human embryonic progenitor cells (4D20.8 cell line and primary cells), human primary endothelial cells, human mesenchymal stem cells, and rat primary neonatal cardiomyocytes were processed with either the standard ATAC-Seq protocol* (blue), Omni ATAC-Seq protocol# (orange), or Active Motif’s ATAC-Seq protocol (purple). Active Motif’s ATAC-Seq protocol consistently gives higher FRiP scores in a variety of samples.
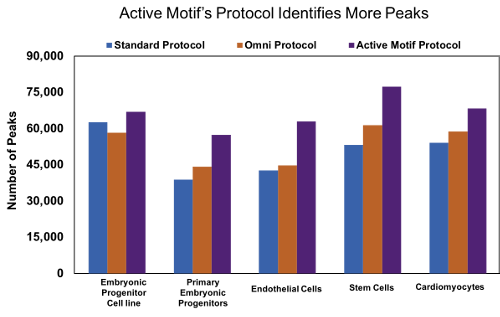
Figure 9: Active Motif’s optimized ATAC-Seq protocol results in increased number of peaks.
Human embryonic progenitor cells (4D20.8 cell line and primary cells), human primary endothelial cells, human mesenchymal stem cells, and rat primary neonatal cardiomyocytes were processed with either the standard ATAC-Seq protocol* (blue), Omni ATAC-Seq protocol# (orange), or Active Motif’s ATAC-Seq protocol (purple). Samples processed with Active Motif’s ATAC-Seq protocol consistently identify more peaks in a variety of samples.
References for ATAC-Seq & Omni ATAC-Seq publications
- Buenrostro, J.D. et al. Transposition of native chromatin for fast and sensitive epigenomic profiling of open chromatin, DNA-binding proteins and nucleosome position, Nature Methods. 2013; 10:1213-1218.
- Corces, M.R. et al. An improved ATAC-seq protocol reduces background and enables interrogation of frozen tissues, Nature Methods. 2017; 14:959-962.
ATAC-Seq Services Publications
Search our database of customer publications that have used our ATAC-Seq services.
ATAC-Seq Services Documents
ATAC-Seq Services Sample Submission Portal
Our online sample submission portal allows you to easily upload your service project samples and track your project status. Follow the sample submission instructions in the portal to ensure that all your samples arrive at Active Motif in the best possible condition and properly associated with your project.
You might also be interested in:
| Name | Cat No. | Price | |
|---|---|---|---|
| ATAC-Seq Service | 25079 | Get Quote | |
| Active Motif Epigenetic Services Brochure |
| Comprehensive ATAC-Seq Solutions Brochure |
| ATAC-Seq Sample Preparation |
| Epigenetic Services Citations |
Figure 1: Active Motif’s ATAC-Seq assay reliably detects regions of open chromatin.DNAse-Seq, which has long been the gold standard for generating genome-wide profiles of open chromatin, is shown above in blue. The utility of DNAse-Seq has been limited since it requires tens of millions of cells and is technically challenging. Active Motif’s ATAC-Seq (shown above in green), uses only 50,000 cells and provides data that is comparable to DNAse-Seq.
Figure 2: Active Motif’s ATAC-Seq assay distinguishes sample groups by identifying chromatin regions that are differentially open.The example above shows ATAC-Seq data from 4 different samples, each performed in triplicate. Differentially open regions are highlighted in yellow.
Figure 3: Identifying important transcription factor binding sites using ATAC-SeqThe underlying DNA sequence of differentially open chromatin regions can be analyzed to identify the most enriched transcription factor binding sites. In this cell system the two most enriched binding motifs are also relevant to B cell biology. Fra1 is quickly upregulated upon B cell activation and PU.1 is a key regulator of B cell fate specification.
Figure 4: Distribution of Histone Modifications Relative to ATAC-Seq Peaks at Annotated PromotersComparison of ATAC-Seq data to different histone modification ChIP-Seq data sets reveals that ATAC-Seq peaks at promoters are most enriched for H3K4me3 and H3K9Ac.
Figure 5: Distribution of Histone Modifications Relative to ATAC-Seq Peaks Outside of Annotated PromotersATAC-Seq peaks outside promoters are enriched for all active marks including the enhancer marks H3K27Ac and H3K4me1.
Figure 6: Active Motif’s ATAC-Seq data generated from tissuesThe images above show ATAC-Seq data generated using frozen mouse liver and lung tissue. The open chromatin profiles are similar to DNAse-Seq profiles generated by the ENCODE consortium.
Figure 7: Active Motif’s ATAC-Seq data shows high reproducibilityThe experiment above was performed using a cell line that was left untreated or treated under three different conditions and each condition was performed in triplicate. The correlation coefficients are presented in the heat map. Replicates have coefficients of at least 0.96. The heat map shows that the samples cluster into four distinct groups as expected.
ATAC-Seq Quality Measures
There are multiple ways to assess the quality of an ATAC-Seq data set. The two that are considered the most important are FRiP Score and Peak Number.
- FRiP Score: Fraction of Reads in Peaks is the percentage of reads that overlap within called peaks. It is a measure of the enrichment of open regions and can also be considered as a measure of signal-to-noise, with signal being reads that map in peaks and noise being reads that map outside of peaks. FRiP scores will vary depending on cell type. FRiP scores of >30% are a good indication of success. However, lower FRiP scores are acceptable in more difficult samples as long as there is consistency across those samples.
- Peak Number: Number of peaks identified in an ATAC-Seq data set. Data repository consortia like ENCODE recommend that data sets have more than 50,000 peaks identified. This however varies depending on the cell type, tissue and health of cells.
Figure 1: Active Motif’s optimized ATAC-Seq protocol results in increased FRiP scores.Human embryonic progenitor cells (4D20.8 cell line and primary cells), human primary endothelial cells, human mesenchymal stem cells, and rat primary neonatal cardiomyocytes were processed with either the standard ATAC-Seq protocol* (blue), Omni ATAC-Seq protocol# (orange), or Active Motif’s ATAC-Seq protocol (purple). Active Motif’s ATAC-Seq protocol consistently gives higher FRiP scores in a variety of samples.
Figure 2: Active Motif’s optimized ATAC-Seq protocol results in increased number of peaks.Human embryonic progenitor cells (4D20.8 cell line and primary cells), human primary endothelial cells, human mesenchymal stem cells, and rat primary neonatal cardiomyocytes were processed with either the standard ATAC-Seq protocol* (blue), Omni ATAC-Seq protocol# (orange), or Active Motif’s ATAC-Seq protocol (purple). Samples processed with Active Motif’s ATAC-Seq protocol consistently identify more peaks in a variety of samples.
References for ATAC-Seq & Omni ATAC-Seq publications
- Buenrostro, J.D. et al. Transposition of native chromatin for fast and sensitive epigenomic profiling of open chromatin, DNA-binding proteins and nucleosome position, Nature Methods. 2013; 10:1213-1218.
- Corces, M.R. et al. An improved ATAC-seq protocol reduces background and enables interrogation of frozen tissues, Nature Methods. 2017; 14:959-962.